Stock market chart we wish to forget
S&P 500 Technicals Reveal Ominous Reminders of 2001, 2008: Chart
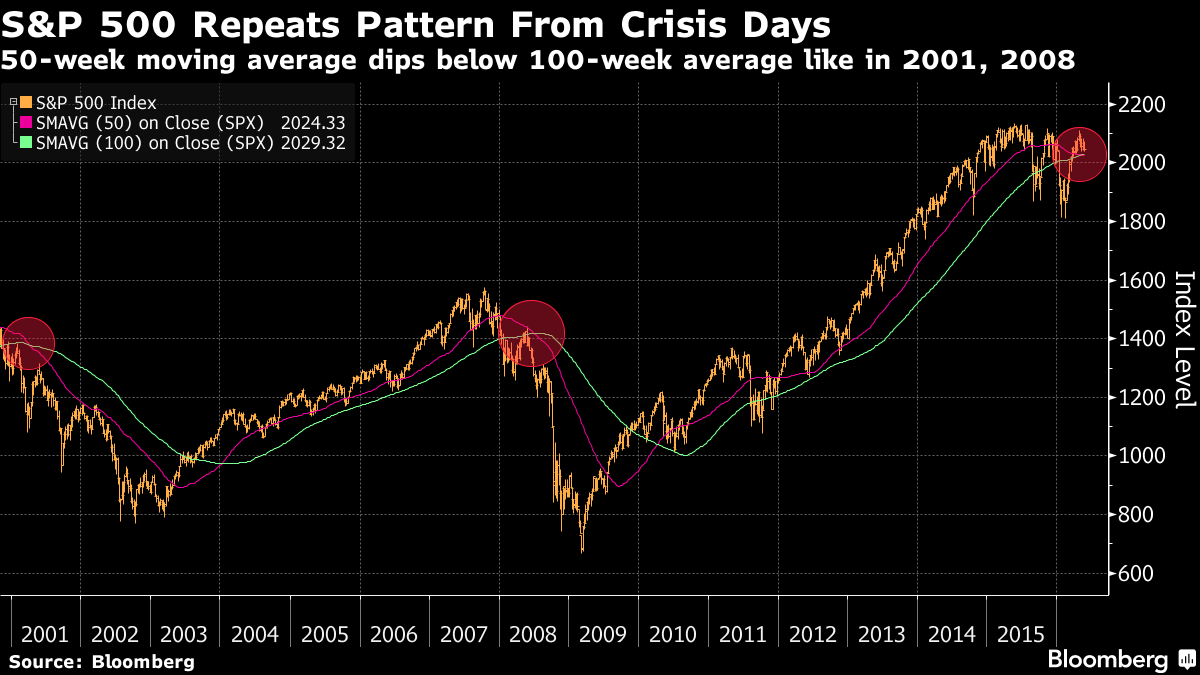
The S&P 500 Index’s 50-week moving average just fell below its longer-term mean, repeating a pattern seen in 2001 and 2008. While daily moving averages aren’t in a bearish zone, pessimism has been growing among investors amid lackluster corporate earnings, concern over the health of the global economy and uncertainty about the timing of Federal Reserve rate increases. The U.S. equity gauge tumbled as much as 11 percent this year before erasing losses.
Comments
Post a Comment